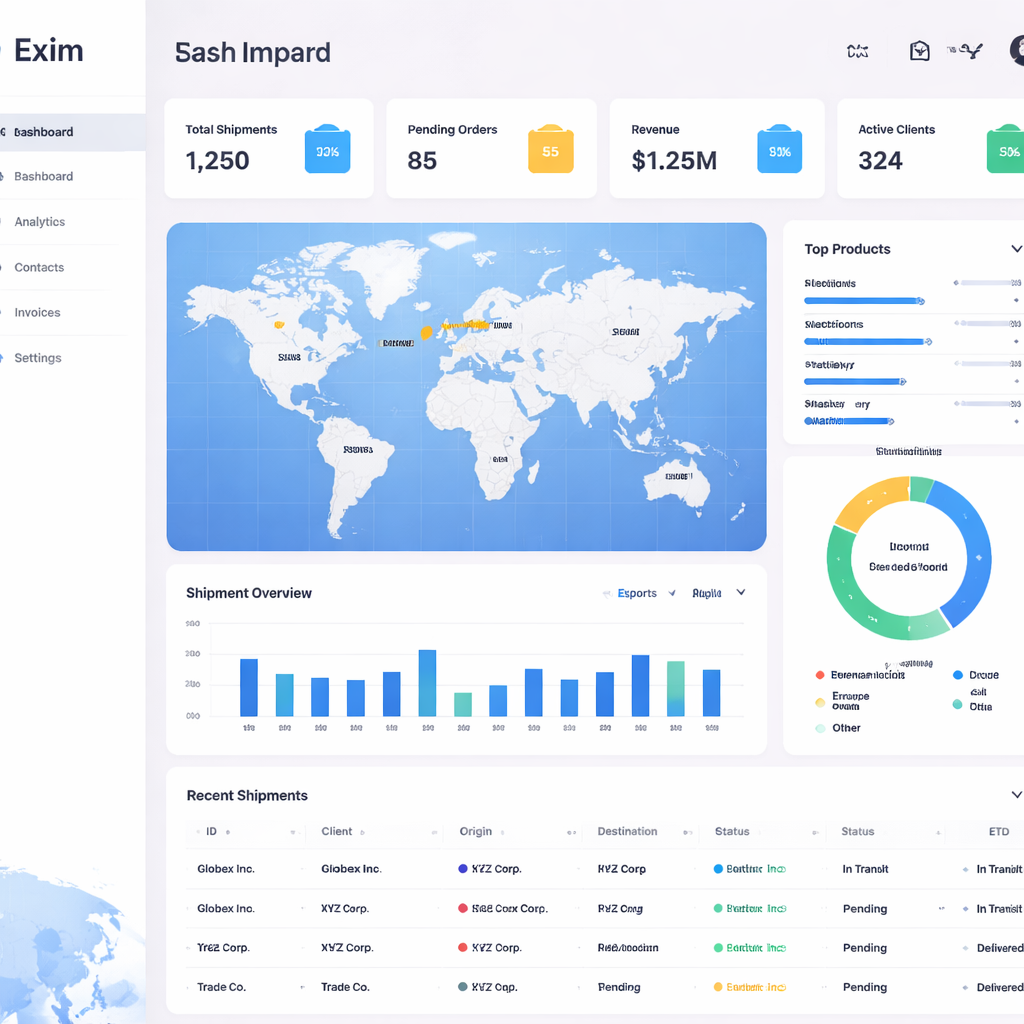
Shipment-level customs records with named importers and exporters, HS codes, quantities, declared values and ports — across 200+ countries.
Get a free demo ›List your export or import business, publish your catalogue and receive buyer enquiries direct. No listing fee, no commission and no paid ranking — there is nothing here to buy.
Why it is free ›Trade intelligence for 200+ countries
Shipment-level customs records from 200+ countries — named importers and exporters, HS codes, quantities, declared prices and ports.
Try “India”, “coffee”, or “0901” — searches 99 countries and 98 HS chapters
| Importer | HS code | Origin | Quantity | Value | YoY |
|---|---|---|---|---|---|
| Nordic Coffee AB | 0901.11 | Brazil | 18,000 kg | $52,400 | +14% |
| Bella Roasters SpA | 0901.11 | Colombia | 24,500 kg | $71,900 | +8% |
| Meridian Foods Ltd | 0901.21 | Vietnam | 9,200 kg | $26,100 | +22% |
| Kaffe Handel GmbH | 0901.11 | Ethiopia | 31,750 kg | $94,300 | +11% |
Why it matters
Every consignment that crosses a border leaves a declaration behind. Aggregated, those declarations answer the questions traders actually pay consultants to guess at.
Every market below files its trade totals with the UN. These are the real, latest-reported figures — the same baseline our shipment-level records sit on top of.
| # | Market | Imports | Exports | Year |
|---|---|---|---|---|
| 01 | China | $2.59T | $3.58T | 2024 |
| 02 | United States | $3.36T | $2.06T | 2024 |
| 03 | Germany | $1.38T | $1.63T | 2024 |
| 04 | Japan | $742.7B | $707.4B | 2024 |
| 05 | France | $762.0B | $646.0B | 2024 |
| 06 | Hong Kong | $697.9B | $639.4B | 2024 |
| 07 | United Kingdom | $813.3B | $520.2B | 2024 |
| 08 | Netherlands | $621.1B | $699.3B | 2024 |
| 09 | South Korea | $631.7B | $683.1B | 2024 |
| 10 | Italy | $621.6B | $673.9B | 2024 |
| 11 | Mexico | $636.8B | $619.7B | 2024 |
| 12 | India | $697.7B | $434.4B | 2024 |
| 13 | Canada | $560.0B | $569.3B | 2024 |
| 14 | United Arab Emirates | $470.5B | $570.2B | 2023 |
| 15 | Singapore | $457.5B | $504.8B | 2024 |
Source: UN Comtrade, official statistics reported by national authorities. Figures are country-level aggregates, not shipment records.
Whether you are sourcing a product, hunting for buyers, or defending market share, the answer is already in the customs record. We make it searchable.
Search any HS code and get a ranked list of companies actively importing it, with shipment volumes and trade values.
Learn more ›Identify exporters shipping your product, see who they ship to, and shortlist on real trade history rather than directory listings.
Learn more ›Follow a named company's shipments — what they move, where from, in what volume, and at what declared price.
Learn more ›Compare declared unit prices across suppliers and origins so you negotiate from evidence, not guesswork.
Learn more ›Drill through all 98 HS chapters down to 8-digit tariff lines to isolate exactly the product you trade.
Learn more ›Look up applicable customs duty and landed-cost components before you commit to an order.
Learn more ›The data
Not modelled estimates or self-reported profiles — declared consignments, field by field.
Bills of entry and shipping bills as filed with the national customs authority, including value and duty detail.
Learn more ›Ocean manifests naming consignee, shipper, vessel, container count and the port pair for each movement.
Learn more ›Consolidated trade history per company — products, partners, volumes and consistency over multiple years.
Learn more ›The full HS nomenclature, national tariff lines and the duty components that follow from them.
Learn more ›From a blank search box to a qualified shortlist, usually inside an afternoon.
Enter an HS code, a product keyword, or a company name and pick your market.
Narrow by country, port, date range, value band or trading partner.
Read the shipment trail — volumes, prices, partners and seasonality.
Export to Excel, or take the enriched contact details straight to outreach.
Coverage
Detailed shipment records for the world's most active trading markets, with statistical coverage everywhere else.
A directory lists companies that registered themselves. We list companies that actually shipped, with the dates and volumes to prove it.
Each row is a real declared shipment. These are the fields you can search, filter and export.
| Field | What it tells you |
|---|---|
| Shipment date | When the consignment actually cleared customs |
| Importer & exporter | The named counterparties on the declaration |
| HS code | The tariff classification, to 8 digits where published |
| Product description | The description as filed, not a category guess |
| Quantity and unit | Volume shipped, in the declared unit of measure |
| Unit price and total value | Declared value, for price benchmarking |
| Origin and destination | Country pair for the movement |
| Ports and transport mode | Loading and discharge port, sea or air |
Results
“We replaced a six-week market study with two afternoons in the shipment data. The buyer list we built from it converted three accounts in the first quarter.”
“Being able to see a supplier's actual shipping history before wiring a deposit has changed how we onboard. We have walked away from two deals because of it.”
“Price benchmarking by origin gave us the evidence to renegotiate a contract we had been overpaying on for two years.”
Nothing crosses a border without being classified first. Customs files every consignment under a Harmonized System chapter, which is why an industry question — who is importing LED lighting, what is cotton yarn actually selling for, which markets buy Indian spices — is answerable from the declaration itself rather than from a survey. Pick the industry, land on the chapter, read the trade.
Machine tools, pumps, material handling, textile and packaging machinery, plant equipment and used machinery lines.
Learn more ›Electrical machinery, LED and lighting, solar, automation, electronic components and tracking systems.
Learn more ›Organic and inorganic chemicals, laboratory reagents, gases, dyes, pharmaceutical formulations and intermediates.
Learn more ›Cotton, yarn, fabric, knitted and woven apparel, hosiery, home furnishing, carpets and technical textiles.
Learn more ›Cereals, spices, tea and coffee, fruit and nuts, seafood, edible oils, processed food and beverages.
Learn more ›Iron and steel, aluminium, copper, scrap, polymers, cement, stone, tiles, sanitaryware and hardware.
Learn more ›India, city by city
An Indian customs record carries the port of clearance and the declared address behind the shipment, so the national picture breaks down into real places — the NCR engineering belt, the Gujarat and Maharashtra export corridor, the Tirupur and Coimbatore textile clusters, the eastern mineral ports. That is how you find counterparties you can actually visit.
The same record read from the other side of the border is a buyer list. Take the HS code you sell, look at which countries import it in volume, and the consignees that recur period after period are the accounts worth approaching — already buying your category, already clearing customs for it, already at the scale you need.
United States and Canada import records with bill of lading detail, plus Mexico and the Central American trade lanes.
Learn more ›Germany, the United Kingdom, France, Italy, the Netherlands and the wider EU trading bloc, by product and by partner.
Learn more ›UAE, Saudi Arabia, Qatar, Oman and Kuwait — re-export hubs as well as end markets.
Learn more ›China, Japan, Korea, Vietnam, Thailand, Indonesia, Malaysia, Singapore and the Philippines.
Learn more ›Bangladesh, Sri Lanka, Nepal and Pakistan — the neighbouring markets with the shortest lead times.
Learn more ›South Africa, Nigeria, Kenya, Egypt, Brazil, Argentina, Chile, Colombia and Peru.
Learn more ›New · free for everyone
Customs data tells you which markets and tariff lines are worth entering. The marketplace tells you who is actually in them. List your export or import business, publish your catalogue and receive buyer enquiries direct — no listing fee, no commission and no paid ranking, and nothing here to buy.
Three steps: your account, your business, then three products or services. Your listing page publishes itself the moment the third is saved.
Learn more ›Every GSTIN and IEC on a listing is checked for structure and check digit the moment it is entered, and each badge says exactly what was verified — and what was not.
Learn more ›Describe what you want to buy once and let suppliers come to you. Your contact details stay private and are never sold as leads.
Learn more ›Every subject this site covers, in one index — industry and product family, Indian city and state, overseas market, company type, sector equipment demand and the datasets themselves. Open a group to see what sits under it.
Thirty-eight industries, each mapped to the HS chapters customs files it under.
All 98 Harmonized System chapters, each with its own leading markets and values.
The northern industrial belt, from the NCR cluster to the hill states.
The Maharashtra and Gujarat export corridor plus the central manufacturing states.
Port cities and manufacturing clusters across Karnataka, Tamil Nadu, Telangana, Andhra and Kerala.
Eastern ports, mineral belts and the north eastern border trade states.
Ninety-nine markets with reported totals, partner countries and chapter breakdowns.
Cross-border demand for a specific product family, wherever it is being bought.
The same customs record read by the kind of business behind the shipment.
What each service sector actually brings across the border to run its operation.
The product categories behind India's major trade fairs, in shipment terms.
The data products themselves — what you can search, export and subscribe to.
How to actually use the record: classification, documentation, pricing and sourcing.
Terminology
The vocabulary that appears on every customs record, in plain language.
| Term | What it means |
|---|---|
| HS code | The Harmonized System classification for a product — 2-digit chapter, 6-digit international subheading, 8 or more digits nationally. |
| Bill of entry | The declaration an importer files to clear goods into a country. |
| Shipping bill | The equivalent declaration filed by an exporter sending goods out. |
| Bill of lading | The carrier document naming shipper, consignee, vessel and port pair. |
| Consignee | The party the goods are shipped to — usually the buyer. |
| Declared value | The value stated on the declaration, the basis for duty assessment. |
| Unit price | Declared value divided by declared quantity — the benchmarking figure. |
| Port of loading | Where the consignment left; port of discharge is where it arrived. |
| Country of origin | Where the goods were produced, which is not always where they shipped from. |
| Landed cost | Product cost plus freight, insurance, duty and clearing charges. |
Import export data is the shipment-level record generated when goods cross a customs border. Each record names the importer and exporter, the HS code, the product, the quantity, the declared value, and the ports involved. Aggregated across millions of shipments it shows exactly who is buying what, from whom, and at what price.
We cover trade data for 200+ countries, including detailed shipment-level records for India, the United States, Vietnam, Indonesia, Brazil, Mexico and most of Latin America, Africa and South East Asia, plus statistical trade data for the remainder.
Most countries are refreshed monthly. A few customs authorities publish on a 45 to 60 day cycle, and those markets are updated as soon as the release is available.
Records are compiled from official customs filings, bills of lading and port authority manifests. Nothing is modelled or estimated: every row traces back to a real declared shipment.
Yes. Search by HS code or product keyword and filter by country to get a ranked list of active importers and exporters, with shipment counts and trade values so you can judge who is worth approaching.
Yes. Request a free demonstrative report on your product and we will show you live sample records for your HS code before you commit to anything.
Search results export to Excel and CSV. Enterprise plans add scheduled reports and API access.
One workspace covers every market we carry, so you are not stitching together separate country subscriptions. Search is HS-code native, results are shipment level rather than summarised, and contact enrichment is included rather than sold as an add-on.
Yes. Every industry maps onto one or more Harmonized System chapters — garments to chapters 61 and 62, plastics to 39, machinery to 84, electricals to 85 — and each chapter page carries the markets trading it, the partner countries and the reported values. Start from the industry directory on this page and drill into the chapter.
Indian customs records carry the port of clearance and the declared address of the importer or exporter, so shipments can be read by city and by state — the NCR belt, the Mumbai and Gujarat export corridor, the Tamil Nadu and Karnataka clusters, the eastern ports. The India import and export hubs are the entry point for all of them.
Work backwards from the import record. Pick the HS code you export, then look at which countries import it in volume and which named consignees appear repeatedly. That gives you a buyer list sorted by demonstrated purchasing rather than by directory listing.
Yes. Filter export records by country of origin and HS code to see who is shipping the product out of that market, how often, and in what quantity. Consistency across periods is usually a better signal of reliability than any self-declared profile.
The Harmonized System is the international product nomenclature customs uses to classify goods — two digits for the chapter, six digits internationally, eight or more nationally. It matters because duty rates, restrictions and every statistic in the trade record follow from the code, so the wrong classification means the wrong numbers.
Both. Customs declarations carry the value and duty detail; ocean bills of lading carry the consignee, shipper, vessel, container count and the port pair. Read together they describe the same movement from two angles.
Yes. Any search result exports to Excel or CSV, and enterprise plans add scheduled reports and API access so the data can feed your own systems directly.
Multi-year history is available for the detailed markets, which is what makes trend and seasonality analysis possible — a single period tells you what happened, several periods tell you whether it is growing.
Tell us the HS code or product you care about and we will send a sample report drawn from live customs records — no call required.